For over 40 years producers have used NDVI to assess the health of their crops. Some people have never heard of NDVI in this post I will explain what it is and how it can help you produce more using fewer inputs.
First, we will look a bit at the history of where this technology started. To do that we need to go back to the beginning of the space programs in both the USA and the Soviet Union. These programs were instrumental in the development of dedicated meteorological satellites. These satellites lead to the development of reflective sensors n both the red filtered and near-infrared (NIR) bands as well as thermal infrared. During the same time, NASA developed the Earth Resources Technology Satellite (ERTS) which was a precursor to the Landsat program. The main reason these particular sensors were used is they enable the easy differentiation between landmass and cloud cover.
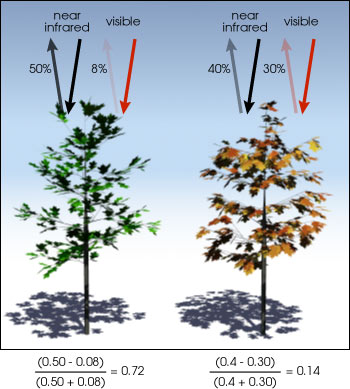
During these studies, scientists used Landsat 1 with its multispectral scanner to study the spring green-up and fall dry-down. They were, however, unable to correlate the biophysical characteristics of the plants due to the satellite zenith angles. With the assistance of the resident mathematicians, they were able to devise a formula to calculate the ratio between red and NIR reflected light. They called this formula “Vegetation Index” however, there were several other scientific groups studying in similar fields and changed the name to what we know today, “Normalized Difference Vegetation Index” or NDVI. As it turns out NDVI was the most successful of many attempts to simply and quickly identify vegetated areas and their condition and it remains the most well-known and useful index.
An area that contains a dense vegetation canopy will tend to show positive values (0.3 – 0.8) while snow-covered fields and clouds will show negative values. Freestanding water such as lakes, rivers and even some sloughs will show very low positive values, also some soils with show a slightly positive NDVI value.
A few issues that we need to watch out for are atmospheric conditions such as water vapour and aerosols can significantly affect the measurements taken from space. This leads to misinterpretation errors if the NDVI value is calculated directly from the raw data. Deep clouds can be very noticeable on satellite scans and can be calculated out to a certain extent. However, thin clouds or small clouds can significantly contaminate the readings and lead to misinterpretations. These issues can be mitigated to a certain extent by daily or nearly daily imaging to create composite images. Soil effects can also be problematic, soils tend to darken when wet so their reflectance is a direct function of water content. If the spectral response to moisture is not exactly the same in two spectral bands the NDVI of an area can appear to change as a direct result of moisture changes, not the vegetation.
With precision agriculture NDVI provides a measurement of crop health. Today that involves drones which are paired with sensors to gather data and recognize crop health problems. Some of these include offerings from Sentara and PrecisionHawk which allow agriculturists to capture ad process data in less than a day. In previous years this was not possible and satellite imaging can have long lag times, allowing a problem to become harder to rectify before it is even known.
With drones, there is less of an issue with cloud cover and the images are all captured in one session leading to more accurate results from the process. This will enable you, as a producer, to act quicker and with better information. Whether in the form of fertilizer, herbicides or other treatments.